Where is the money actually positioned on a perp exchange?
Open interest is not volume
Volume is flow: how much changed hands. Open interest is inventory: how much is still sitting there, carrying risk, waiting to be right or wrong. A market can have enormous volume and almost no open interest if everyone closes out the same day, and it can have enormous open interest and thin volume if positions are held for weeks.
The ratio between them is the useful number, and it varies far more than most people expect. On the day we measured, the largest market turned over 1.35 times its open interest in twenty four hours. The third largest turned over 0.38 times. Same venue, same afternoon, positions held roughly three and a half times longer in one than the other.
How concentrated it is
| Share of the venue | Markets needed |
|---|---|
| 25.2% | 1 |
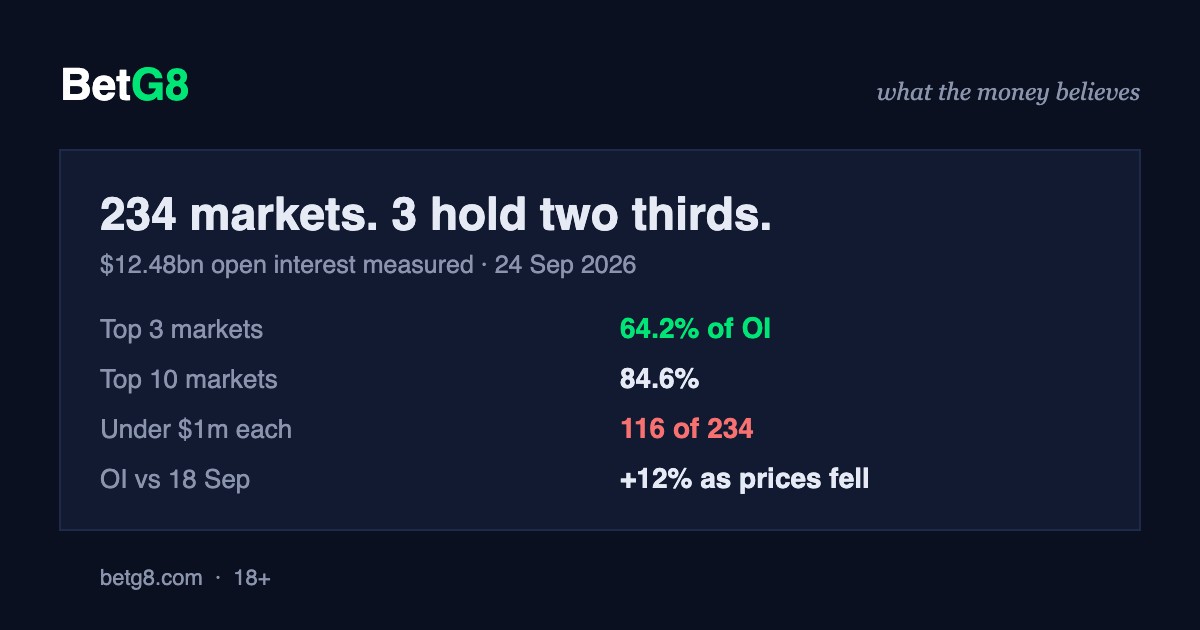
| 64.2% | 3 |
| 75.6% | 5 |
| 84.6% | 10 |
| 90.9% | 20 |
The other 214 markets share the remaining 9.1 percent. Of those, 116 held under one million dollars of open interest each, and 60 held under one hundred thousand. A market with 60,000 dollars of open positions is a listing, not a market.
This is the same shape we have now measured three times in three different places. Prediction market spreads: 45 percent of contracts carried 98.8 percent of the volume. NFL player props: 130 of 148 listed props had never traded. Perp funding: the expensive rates were all in the smallest markets. Long menus, short queues.

The top of the book
| Market | Open interest | 24h volume | Turnover | 24h price |
|---|---|---|---|---|
| BTC | $3,140.9M | $4,248.7M | 1.35x | -2.42% |
| ETH | $2,914.3M | $1,460.8M | 0.50x | -2.14% |
| HYPE | $1,957.6M | $752.2M | 0.38x | -4.33% |
| ZEC | $725.8M | $821.7M | 1.13x | -6.44% |
| SOL | $693.2M | $417.9M | 0.60x | -3.14% |
| NEAR | $336.3M | $455.2M | 1.35x | -5.50% |
| XRP | $274.8M | $225.9M | 0.82x | -7.31% |
| LIT | $241.0M | $98.0M | 0.41x | +4.12% |
The third largest market on the venue is the exchange own token, at nearly two billion dollars of open interest and the lowest turnover in the top five. That is a structurally different kind of position from a BTC perp - held longer, traded less - and it is worth knowing it sits there when reading any venue-wide number.
The six-day divergence
We measured the same venue on 18 September and again today. Total open interest went from 11.11 billion dollars to 12.48 billion, a rise of about 12 percent in six days. Over the same window, seven of the eight largest markets were down on the day we sampled, several of them sharply.
Positions were being added while prices fell. That is worth stating carefully, because it is the kind of observation that invites a story. It does not tell you whether the added positions are long or short, it does not tell you whether they are hedges, and it does not tell you what happens next. What it does say is that money was committing into a falling market rather than stepping away from it.
One related detail: funding on the largest market had fallen to roughly 5.98 percent annualised, below the 10.95 percent structural floor most of the venue was sitting on. Six days earlier that same market was at the floor. Long-side pressure there had eased even as open interest across the venue grew.
How to read a venue-wide number after this
Ask which markets it came from. Any average across 234 perpetual markets is really a statement about three of them, plus noise from 214 that carry nine percent of the money between them.
Separate inventory from flow. Volume rankings and open interest rankings are different lists, and a market can be high on one and low on the other. Turnover is the number that reconciles them.
Treat positioning as description, not prediction. Open interest tells you what has already been committed. It is a photograph of the past, taken from the present, and it contains no information about the future that anyone has reliably extracted.
Method and limits
Source: the venue public info endpoint, read in a single pass on 24 September 2026. Open interest is contract open interest multiplied by mark price, in US dollars. Volume is the venue reported 24 hour notional. Turnover is volume divided by open interest. Price change is mark price against the previous day reference price. The 18 September comparison figure comes from our own capture on that date, taken the same way.
Limits. This is one venue and one moment; concentration and turnover both move. Open interest counts notional, not direction, so nothing here distinguishes long from short positioning. And every figure is venue-wide public market data. Nothing on this page describes any individual account, wallet, position or portfolio, and none is used.
The concentration table and the top-of-book figures are published as a CSV: download the open interest capture (CSV). Reuse is fine with or without credit.
Frequently asked questions
What is open interest on a perpetual futures market?
The total notional value of positions currently held open. It counts money committed, not money traded. Volume tells you how much changed hands; open interest tells you how much is still sitting there carrying risk.
How concentrated is open interest on a perp exchange?
Extremely. Across 234 markets carrying $12.48bn, the largest held 25.2 percent, the top three 64.2 percent and the top ten 84.6 percent, while 116 markets held under $1m each.
What is the difference between volume and open interest?
Volume is flow, open interest is inventory. The ratio is turnover. On 24 September the largest market turned over 1.35x its open interest in a day while the third largest turned over 0.38x.
What does it mean when open interest rises while prices fall?
Positions are being added into weakness rather than closed out. Total open interest rose about 12 percent between 18 and 24 September while most large markets fell. It is a positioning observation, not a forecast.
Why did funding on the largest market fall below the others?
It was quoted at roughly 5.98 percent annualised while most of the venue sat at the 10.95 percent floor, meaning the contract was trading closer to spot and long-side pressure there had eased.
Is this a signal to buy or sell?
No. This page measures where positions sit and how concentrated they are. It makes no claim about direction and is not advice.
Sources
- Hyperliquid public info endpoint, metaAndAssetCtxs, read 24 September 2026. All open interest, volume, funding and price figures come from that single pass.
- BetG8, what a crypto funding rate actually costs you, 18 September 2026, for the earlier capture of the same venue.
- BetG8, funding rate and liquidation calculator.
18+ only. Perpetual futures are leveraged instruments and can lose more than the margin posted. This page reports measured public market data; it is not financial, investment or trading advice, and it is not a recommendation to open, hold or close any position. If gambling or trading stops being fun, help is available at 1-800-GAMBLER.