What does a crypto funding rate actually cost you?
What funding is, in one paragraph
A perpetual futures contract has no expiry date, so there is no settlement to drag its price back in line with the spot market. Funding is the substitute. At fixed intervals, one side pays the other, and the size of the payment scales with how far the contract has drifted from spot. Trading above spot means longs are the eager side, so longs pay shorts. Trading below means the reverse. It is not a fee - the exchange does not take it. It is a transfer between the two sides of the same market.
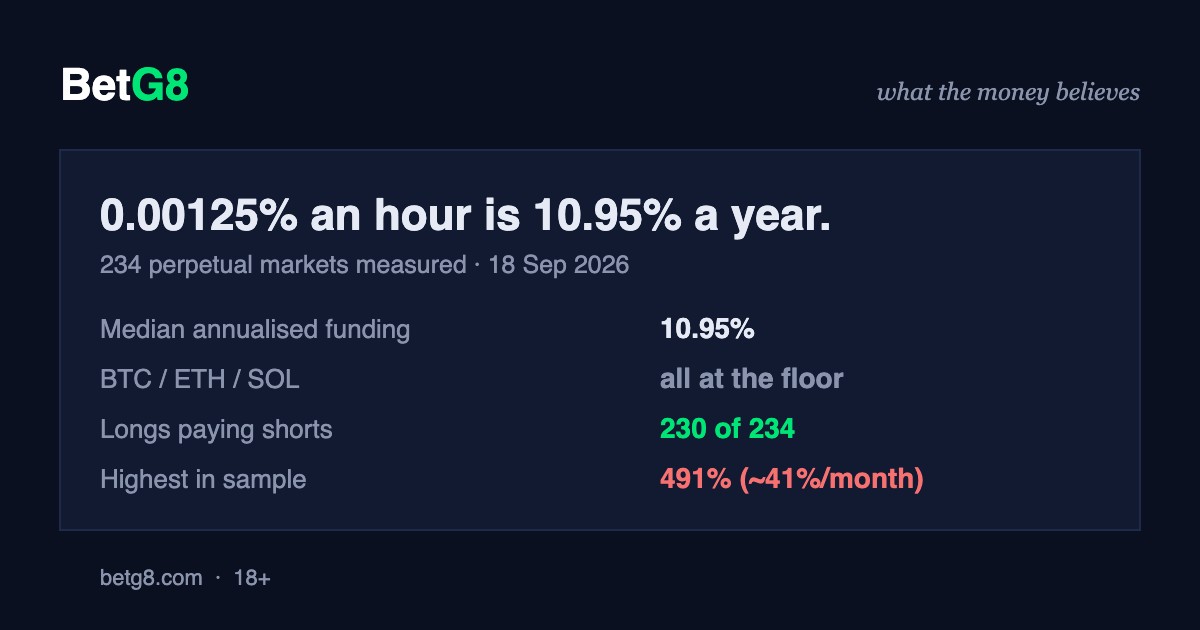
The reason it gets underestimated is presentation. Funding is usually quoted per hour or per eight hours, in numbers like 0.00125 percent. That looks like rounding error. Annualised, the same number is 10.95 percent.
What we measured
Every perpetual market on the venue, read in a single pass on 18 September 2026.
| Measure | Value |
|---|---|
| Markets measured | 234 |
| Total open interest | $11.11bn |
| Median annualised funding | 10.95% |
| Open-interest weighted funding | 12.27% |
| Markets with longs paying | 230 of 234 |
| Markets with shorts paying | 4 |
| Markets above 50% annualised | 7 |
| Markets above 100% annualised | 4 |
The distribution is heavily one-sided and then has a very long right tail. Almost the whole market sits in a narrow band near the floor, and a handful of small markets sit at rates that would consume a position within months.

The detail that explains the median
BTC, ETH and SOL were all quoted at exactly 10.95 percent annualised, the same number as the median across all 234 markets. Between them those three carried about 5.88 billion dollars of open interest, more than half the venue total.
They match because they were all sitting on the structural floor. Funding on these venues includes a baseline component that applies when the contract is trading close to spot, and at the moment we sampled, the largest markets were pinned to it.
That is worth internalising if you hold majors. The funding you pay most of the time is not a sentiment signal and not a crowding penalty. It is a standing cost of the instrument. Roughly 0.9 percent a month, every month, whether the market is excited or asleep.
The tail, where it gets expensive
| Market | Annualised funding | Open interest | Cost per month held |
|---|---|---|---|
| PURR | 491.4% | $13.5M | ~41% |
| AZTEC | 380.3% | $1.4M | ~32% |
| CC | 122.0% | $5.3M | ~10% |
| STRK | 117.4% | $9.6M | ~10% |
| GRASS | 61.2% | $12.0M | ~5% |
The cost column is the funding charge alone, on notional, with no price movement assumed. A long held for a month in the top market would need the price to rise about 41 percent simply to break even on funding. With leverage the funding charge scales with notional while the loss lands on margin, so the effect on posted collateral is considerably larger than these percentages suggest.
Note the open interest column. Every one of those markets is small. The expensive funding is not where the money is, which is the same shape we found when measuring prediction market spreads: the tight markets carry almost all the volume. Cost concentrates where participation does not.
The four markets paying longs
Only four of the 234 had negative funding, meaning the contract was trading below spot and shorts were paying longs. The most negative was SOPH at roughly -160 percent annualised on about half a million dollars of open interest, followed by ANIME, MINA and OP at single to low double digits negative.
A 98.3 percent long-paying rate across a venue is a structural observation rather than a forecast. Perpetual markets attract leveraged long demand as a matter of habit, and the floor component means even a perfectly balanced market still has longs paying something. Reading it as a contrarian signal is a larger leap than the data supports, and this page does not make it.
How to actually use this
Three things follow from the numbers, none of which is a recommendation to take a position.
Annualise before you decide anything. An hourly rate is designed to look negligible. Multiply by 8,760 before you compare it to anything else you pay.
Separate the floor from the signal. If a market is sitting at the baseline, the funding tells you nothing about positioning. Only the excess above the floor carries information, and on the day we measured, most markets had none.
Match the cost to your holding period. Funding is close to irrelevant intraday and dominant over months. The same 10.95 percent rate is a rounding error on a two-hour position and a serious drag on a half-year one. Our funding rate and liquidation calculator does this arithmetic for a given size and holding period.
Method and limits
Source: the venue public info endpoint, read in a single pass on 18 September 2026. Funding is the venue reported hourly rate, annualised by multiplying by 24 and 365 and expressed as a percentage. Open interest is contract open interest multiplied by the mark price, in US dollars. Monthly cost figures are the annualised rate divided by twelve, which is a simple approximation and ignores compounding.
Limits worth stating. This is a single snapshot on one venue, and funding moves continuously - a market at the top of the tail today may be at the floor tomorrow. Rates on other venues differ, sometimes substantially, and this page makes no claim about them. Nothing here describes any individual account, position or portfolio; every figure is venue-wide public market data.
The full table of all 234 markets is published as a CSV: download the funding capture (CSV). Reuse is fine with or without credit.
Frequently asked questions
What is a funding rate?
A perpetual futures contract never expires, so there is no settlement date to pull its price back toward spot. Funding is the mechanism used instead: at regular intervals one side pays the other, sized to push the contract price back toward spot. Above spot, longs pay shorts; below spot, the reverse.
What does funding actually cost to hold a position?
It is a recurring charge on notional, not on margin. At the median rate we measured, 10.95 percent annualised, a month costs roughly 0.9 percent of notional before any price move. On the most expensive market in our sample, at 491 percent, a month would cost roughly 41 percent.
Is funding the same as a fee?
No. Trading fees go to the exchange. Funding goes to the traders on the other side. Nobody takes a cut — it is a transfer between longs and shorts.
Do longs always pay shorts?
No, but overwhelmingly often. Of the 234 markets measured, only four had shorts paying longs.
Why were BTC, ETH and SOL all at the same rate?
All three were sitting on the venue structural floor at 10.95 percent annualised. In those markets the funding being paid reflected no directional pressure at all.
Does a high funding rate mean the price will fall?
Not by itself. It tells you the contract is trading above spot and that longs are crowded enough to pay for it. It says nothing reliable about what happens next.
Sources
- Hyperliquid public info endpoint, metaAndAssetCtxs, read 18 September 2026. All funding, open interest and mark price figures on this page come from that single pass.
- BetG8, funding rate and liquidation calculator.
- BetG8, what it actually costs to trade on a prediction market, 11 September 2026.
18+ only. Perpetual futures are leveraged instruments and can lose more than the margin posted. This page explains how a cost mechanism works and reports measured public market data; it is not financial, investment or trading advice, and it is not a recommendation to open, hold or close any position. If gambling or trading stops being fun, help is available at 1-800-GAMBLER.